
Description
The point cloud viewer tool is a major part of the Hyperspec ground truthing tool. Point cloud viewer tool allows users to view and interact with point cloud data, a set of data points in 3D space. These data points can be collected from lidar sensors and are often used in a variety of applications, such as autonomous driving, robotics, and computer vision, where the accuracy of the data is crucial for the performance of the system. They can also be used in mapping, surveying, and remote sensing to ensure that the data is accurate and can be used to make accurate decisions and predictions.
To use the Point cloud viewer tool, the user must first log in to the Roadmentor dashboard. Once logged in, the user should navigate to the trip database within the dashboard. In the trip database, the user can select the specific trip that they want to work with. Once the trip is selected, the user will see 4 tool options, Point cloud viewer dense is one of them.
How to Open the Tool
Once the user opens the dashboard, can navigate to the trip they want to ground truth. They will have four options to choose from. The user can select the Point Cloud Viewer Dense.
The tool may take 2 to 3 minutes to load all the lidar frames. Point cloud viewer dense tool generally loads 65 to 70 frames at once. The user should wait for all the frames to load before starting the ground truth process
once a user opens the Point cloud viewer dense tool, they should be able to see the user interface, which typically includes a point cloud display, various controls, options for annotation, individual frame details, and any other relevant information or tools that are part of the software.
User Interface
Hyperspec ground truth point cloud viewer interface typically includes the following features:
- A 3D view window that displays the point cloud data, wired frame buildings, and annotated features imported from the map aligner tool.
- Navigation tools such as pan, zoom, and rotate allow the user to view the point cloud from different perspectives.
- Point selection and measurement tools allow the user to select individual points or groups of points and measure distances and angles between them.
- A task navigation bar that can show the progress to users.
- Filtering tools allow the user to isolate specific frames of interest within the point cloud.
- Frame adjustment capabilities are individual and global such as easting, northing, and Z to adjust as per the reference.
- Frame angle correction capabilities global and individuals such as pitch, Roll, and yaw.
- Registration and report generation capabilities allow the user to export the point cloud or specific regions of interest to other software for further analysis and use.
- Publish: Clicking on the "Publish" button will create a copy of the entire created dataset.

3D window
A 3D interface in Hyperspec point cloud viewer tool is a graphical representation of frame-by-frame point cloud data that allows users to interact with and visualize the data in a three-dimensional space. The interface typically consists of a 3D view window that displays the point cloud as a collection of points, with each point represented as a small dot.
Users can navigate through the 3D view window by using tools such as pan, zoom, and rotate to view the point cloud from different angles and perspectives. This allows users to gain a better understanding of the spatial relationships and features within the point cloud data.
Navigation Tools
Zoom: user can use the mouse scroll wheel to zoom in and out.
Pan: The user can use the pan feature to move the map around and view different areas. Users can hold the control key and additionally click and drag the point cloud using the mouse.
Rotate: The tool allows the user to rotate the map to get an angular view of the location. Users can use the rotate feature by clicking anywhere inside the window and dragging it.
Overall, the 3D interface in a point cloud viewer tool provides an interactive and immersive way to explore and analyze point cloud data.
Navigation Taskbar
The navigation taskbar is a graphical user interface element that displays the progress of a task. It is typically a bar that is filled in as the task progresses, with the blue color indicated on the bar. Progress bars can be used to indicate the progress of a frame attended. Users can select any point of task by selecting the location. It shows the starting frame time stamp as well.
Filtering Tool
The filter tool in a point cloud viewer tool is a feature that allows users to filter and narrow down the displayed frames based on specific criteria. This can be useful for quickly locating and identifying specific frames on a point cloud. The filter tool allows users to quickly and easily identify and locate specific data points, by narrowing down the displayed data based on specific criteria, such as location.
Northing, Easting, and Z
When a point cloud needs to be shifted in reference to the Y coordinate, the user can use the Northing positive and negative buttons as per the requirement. A positive Northing value will move the point cloud in the positive Y direction (north) and a negative Northing value will move the point cloud in the negative Y direction (south). Similarly, the user can use a positive Easting value to move the point cloud in the positive X direction (east) and a negative Easting value to move the point cloud in the negative X direction (west). Z also works similarly, the positive Z button moves the point cloud in the positive Z direction and the negative Z button moves the point cloud in the negative Z direction.

Pitch, Roll, and Yaw
Pitch, roll, and yaw are rotational movements that can be used to correct the orientation of a point cloud. Pitch refers to rotation around the X-axis, roll refers to rotation around the Y-axis, and yaw refers to rotation around the Z-axis.
Adjusting pitch, roll, and yaw can be used to correct any misalignment in the point cloud. For example, if the point cloud is tilted to the left, the roll value can be adjusted to correct it. Similarly, if the point cloud is tilted forward or backward, the pitch value can be adjusted to correct it. And if the point cloud is rotated in a clockwise or counter-clockwise direction, the yaw value can be adjusted to correct it. These adjustments can be done by using positive and negative pitch roll and Yaw buttons in the tool.

| Key Initial | Key Function |
|---|---|
| E- | Easting Negative |
| E+ | Easting Positive |
| N- | Northing Negative |
| N+ | Northing Positive |
| Z- | Z Negative |
| Z+ | Z Positive |
| R- | Roll Negative |
| R+ | Roll Positive |
| R- | Pitch Negative |
| R+ | Pitch Positive |
| Y- | Yaw Negative |
| Y+ | Yaw Positive |
Save The Data
The tool has two types of save options
- Save All
- Individual frame save
Once the user clicks the 'Save All' button, all changes made to all frames will be saved. It may take 15 to 20 seconds for the changes to be saved and for a confirmation message to appear, which the user can see above the frames panel.
Individual save buttons only save changes made to their respective frames. These buttons are located in front of their respective frames in the interface.
Publish
The "Publish" option in a ground-truthing tool is a feature that allows users to save a backup of the ground-truthed dataset values. Once the user has completed and QAed the dataset, they can click on the "Publish" button to save a copy of the dataset.
This backup copy is useful in case the user accidentally deletes the dataset later on. With the backup copy, the user can easily reload the dataset and continue working without having to redo the ground truthing process.
The "Publish" option is particularly useful for quality assurance (QA) purposes. After the user has completed and verified the dataset, they can use the "Publish" option to save a final version of the dataset that has been fully QAed. This allows the user to ensure that the dataset is accurate and reliable before sharing it with others or using it for further analysis.
Overall, the "Publish" option is a valuable feature in a ground-truthing tool, as it provides users with a way to safeguard their work and ensure that they can easily recover from accidental data loss. It is recommended that users make use of this feature after completing the ground truthing and QA process to ensure that their dataset is properly backed up and ready for use.
Download CSV
The "Download CSV" option in a ground-truthing tool is a feature that allows users to export the ground-truthed dataset to a CSV (comma-separated values) file format. When users click on the "Download CSV" option in a ground-truthing tool, they typically get a CSV file that contains the ground-truthed values along with other parameters related to it. These parameters may include attributes such as timestamps, geolocation data, timestamp, latitude, longitude, altitude, roll, pitch, yaw, local xyz error, or other metadata that is relevant to the dataset.
Overall, the "Download CSV" option is a valuable feature in a ground-truthing tool, as it allows users to easily export their ground-truthed data to a common and widely used format for further analysis or sharing.
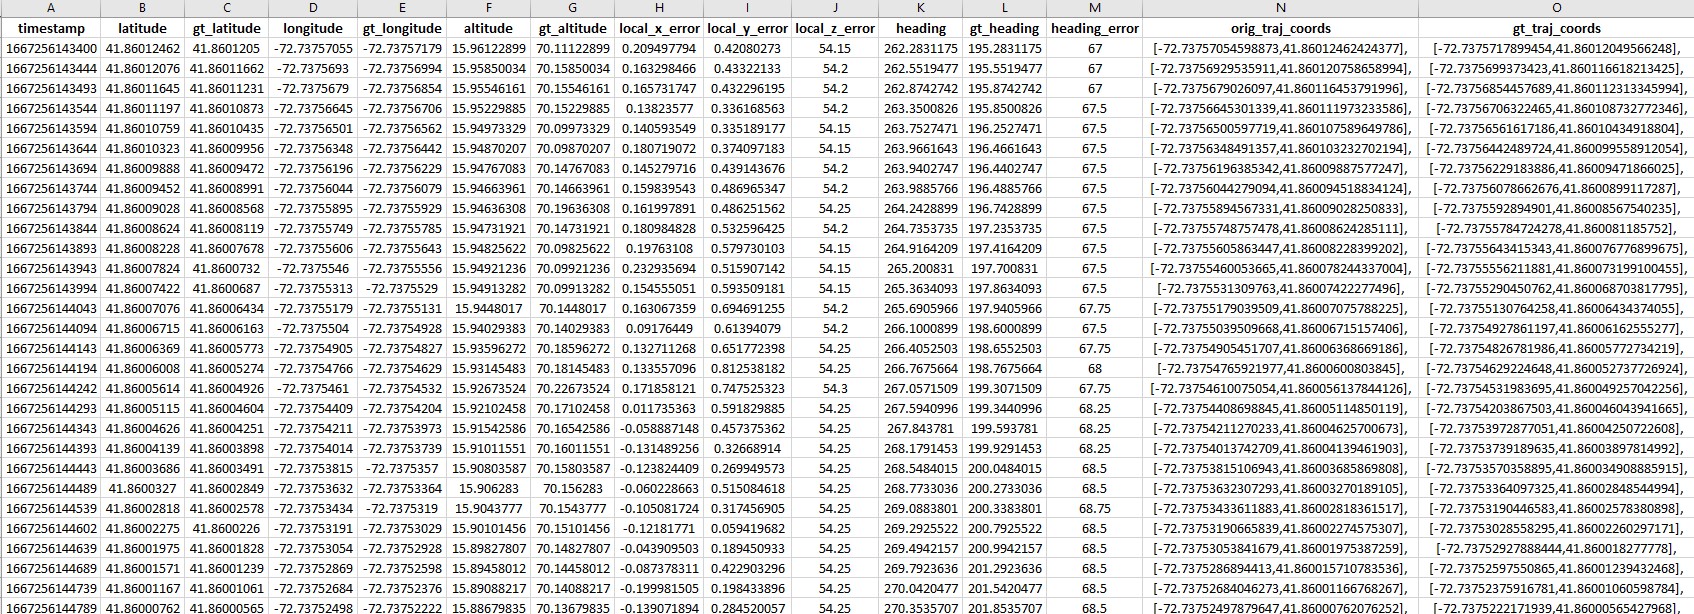
Here is an example of csv file
Download pdf report
The "Download PDF Report" option allows users to create and export a PDF report that summarizes the results of the ground truthing process. This report is called the localization error analysis report.
The PDF report typically includes a summary of the data that was ground-truthed, including any relevant metadata such as Location, Route, Length, Speed, Date of Collection, Weather Conditions, Traffic Conditions, Size of Data, and event description. It may also include a summary of the ground truthing results, including any discrepancies or errors that were identified during the process.
In addition, the PDF report may include visualizations or graphs that help to illustrate the data and the results of the ground truthing process. This can be particularly useful for presenting the data to stakeholders or decision-makers who may not be familiar with the specifics of the ground truthing process.
The "Download PDF Report" option is a valuable feature in a ground-truthing tool, as it allows users to create a standardized and professional-looking report that summarizes the results of their work. This can be particularly useful for documenting the ground truthing process, communicating the results, and using these results for further analysis to others clearly and concisely.
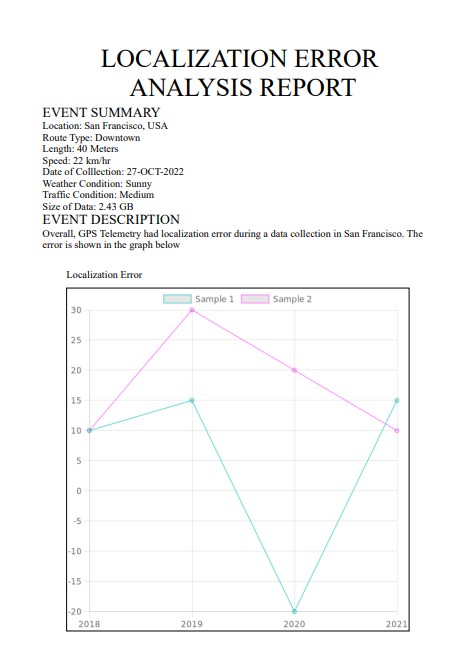
part of a localization error report
Register Point Cloud
Point cloud registration is the process of aligning two or more point clouds to a common reference frame. The result of registration is a single point cloud that represents the combined information from all of the input point clouds. Once the ground truthing process has been completed the user can use the button to register the point cloud.
Global Transformation
The global transformation has all the adjustments explained above. Eg. northing, easting, Z, pitch, roll, and yaw adjustments.
When tools have options to adjust all the frames than what is the need for global transformation?
There may be some situations when the GPS trajectory is way ahead of the actual location.
Here users have to move the frames for longer distances. Individual frame adjustment buttons will not be useful in this situation.
Here users can use the global transformation panel. Users can select any transformation and move the frame as per requirement.

Individual Frame Transformation
In addition to global transformation, the tool also has an option for adjusting individual frames. This is useful when there is a mismatch between two frames. Global transformation can be used to move all frames, a set of frames, or one frame, but for minor adjustments, an individual frame adjustment is often preferred. This is commonly used to match two frames and create a clear, shadow-free point cloud.
In individual frames, the tool has all the same options as global transformation, but these options are associated with their respective frame timestamps. Users can adjust frames for a fixed distance and there are buttons for every individual movement, whether it's negative or positive
Image PC3
As seen in the above image, all adjustment buttons, including the individual save button, are present for the timestamp 1666915675177.

Frame Sort and Filter
The filter tool allows the user to quickly and easily filter the frames (1 or a few frames together) based on exact criteria. Users can use filters to narrow down a large set of frames to only a few to meet certain conditions. This can be useful for adjusting specific frames. To use the filter tool, the user can click on the "frame time stamp" button and hide or unhide the frame. Once the filter is applied, there is an option to inverse the applied criteria. Check out the video to understand more about it. There will be more than 65 frames together user can scroll and check all the frames.

Process
Typically, a trip involves a set of frames for a specific time and distance. The length of a trip can vary, it depends on the speed of the vehicle during data collection. Once all the frames have been loaded into the tool, the user should be able to see the GPS trajectory. In most cases, this trajectory will be way far from the real location.
-
The first step is to identify the start point of the trip based on features in the frame and street view, which are available in the map aligner tool.
-
Once the start point has been determined, the user can begin adjusting the frames. As explained in previous sections, global transformations can be used to make all the frames as close as possible to the actual location.
-
The next step is to start adjusting the first frames in the frames panel. While adjusting the first frames, the user should take reference of the features created in the map aligner tool, as these features will be visible in the tool at their exact location.
-
Once the first frames have been corrected properly, two references are available: the features (buildings, road markings created in the tool) and the first frame, which the user has already adjusted. Since there will always be an overlap between the last frame and the next one, the last adjusted frame will also serve as a reference.
-
In the same way, while working on the third frame, the first and second frames will serve as secondary references, and buildings and road markings will serve as primary references.
-
So, previous frames will always serve as a secondary reference, while the 3D wired frame building and road markings will be the primary reference for adjusting subsequent frames.
To save time when adjusting each frame individually, we have introduced a new option called 'Inherit', which can make the process faster for the user.
Inherit
We have introduced the 'Inherit' option in the mapping process to speed up the matching of frames. The Inherit option can adopt the attributes of the last frame adjustment, reducing the manual effort required. This streamlines the process of adjusting multiple frames. However, the Inherit option may not always produce 100% accurate results, but in most cases, it is correct or close to the actual adjustment.
How to use inherit:
- To use the Inherit option, first, adjust the first two frames as per primary and secondary references.
- Click on the Inherit button for the third frame. The Inherit button will be visible for each frame. Once the user clicks the Inherit button, the frame will adopt the attributes of the last frame adjustment and process the adjustment accordingly.

- In the same way, the user can use the Inherit button for the remaining frames loaded in the tool.
- If the Inherit option is not producing proper results, the user can restart the Inherit process by adjusting one frame manually using the buttons provided in the individual frame adjustment panel. This will feed new adjustment attributes to the Inherit option.
- To use the Inherit option for a new set of frames, the user needs to restart or refresh the frames and provide new adjustment attributes. The rest of the process will remain the same.