Description
The Map Aligner tool is a tool that is the first step to aligning GPS data with a map, typically as part of the process of ground truth data collection. Ground truth data is data that has been verified as accurate and is used to train or validate other data sets.
To use the Map Aligner tool, the user must first log in to the Roadmentor dashboard. Once logged in, the user should navigate to the trip database within the dashboard. In the trip database, the user can select the specific trip that they want to work with. Once the trip is selected, the user will see 4 tool options, map aligner is one of them.
once a user opens the Map Aligner tool, they should be able to see the user interface, which typically includes a map display, various controls and options for annotation, and any other relevant information or tools that are part of the software.

User Interface
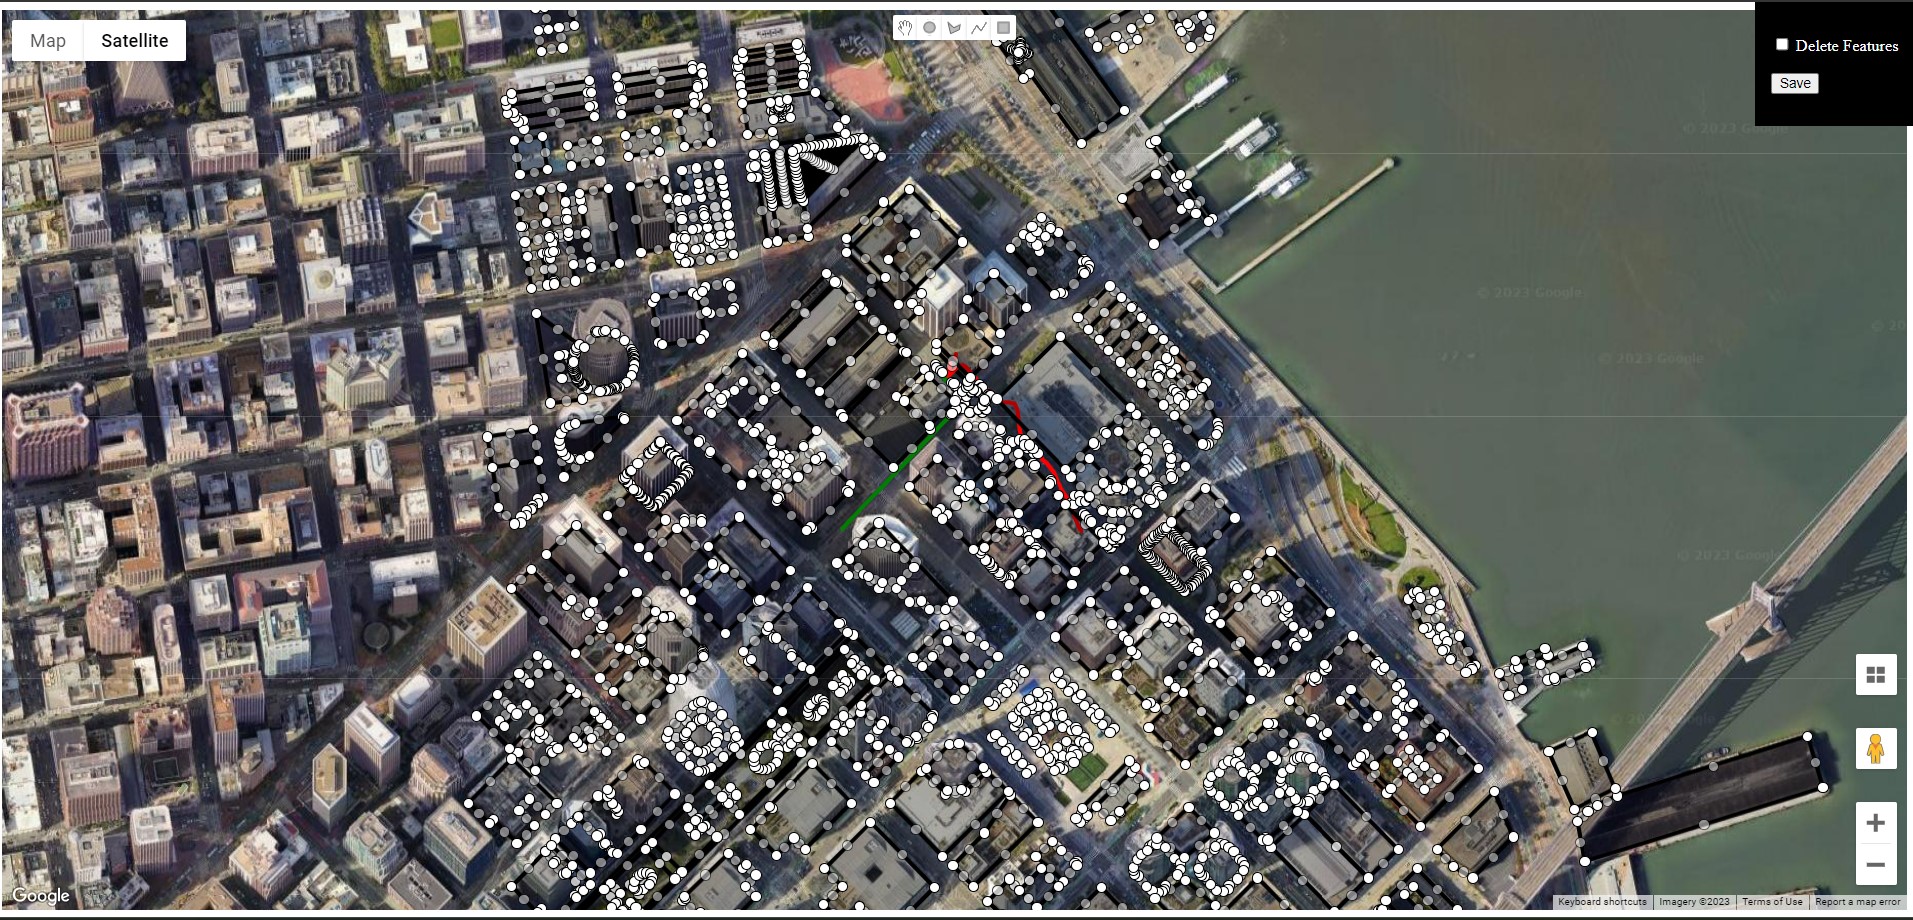
In the above user interface, there are buttons to control the map interface. The buttons in the top left corner may allow the user to switch between different map views (such as street view or satellite view). The buttons in the bottom right corner may allow the user to access additional features, such as the ability to zoom in or out, tilt the map, and check the street view.
In the map/satellite image user will be able to see the buildings. There would be a chance that these buildings will be a few meters away from the actual location. This is mainly because these buildings have been imported from OSM data.
It is possible that the buildings displayed in OpenStreetMap (OSM) may not match the buildings shown in Google Maps. This could be due to a number of factors, such as differences in the data sources used by the two platforms, or differences in the way that the data is processed and displayed.
Annotation feature
In Map Aligner Tool there are 5 different options available for annotation.

-
Stop drawing, allows the user to move around the map, user can use the button to deactivate the drawing feature and hold the left-click mouse button to move around. The line will appear as a 2D object in the point cloud viewer tool.
-
Draw a circle, Hyperspec map aligner tool allows users to draw a circle on the map. Users can place a circle anywhere on the map by clicking and dragging on the map. The line will appear as a 2D object in the point cloud viewer tool.
-
Draw a shape, Allows users to draw custom shapes on the map. Users can place a shape anywhere on the map by clicking and dragging on the map. The shape will appear as a 3D object in the point cloud viewer tool.
-
Draw a line, Allows users to draw lines on the map. Users can place a point anywhere on the map by clicking and dragging as per the requirement. The line will appear as a 2D object in the point cloud viewer tool.
-
Draw a rectangle, Allows the user to draw a rectangle on the map. Users can place a point anywhere on the map by clicking and dragging as per the requirement.
Apart from these 5 annotation buttons, there are two more options in the right top corner, which you can use to delete and save the annotated data.
Trajectories in Map Aligner Tool
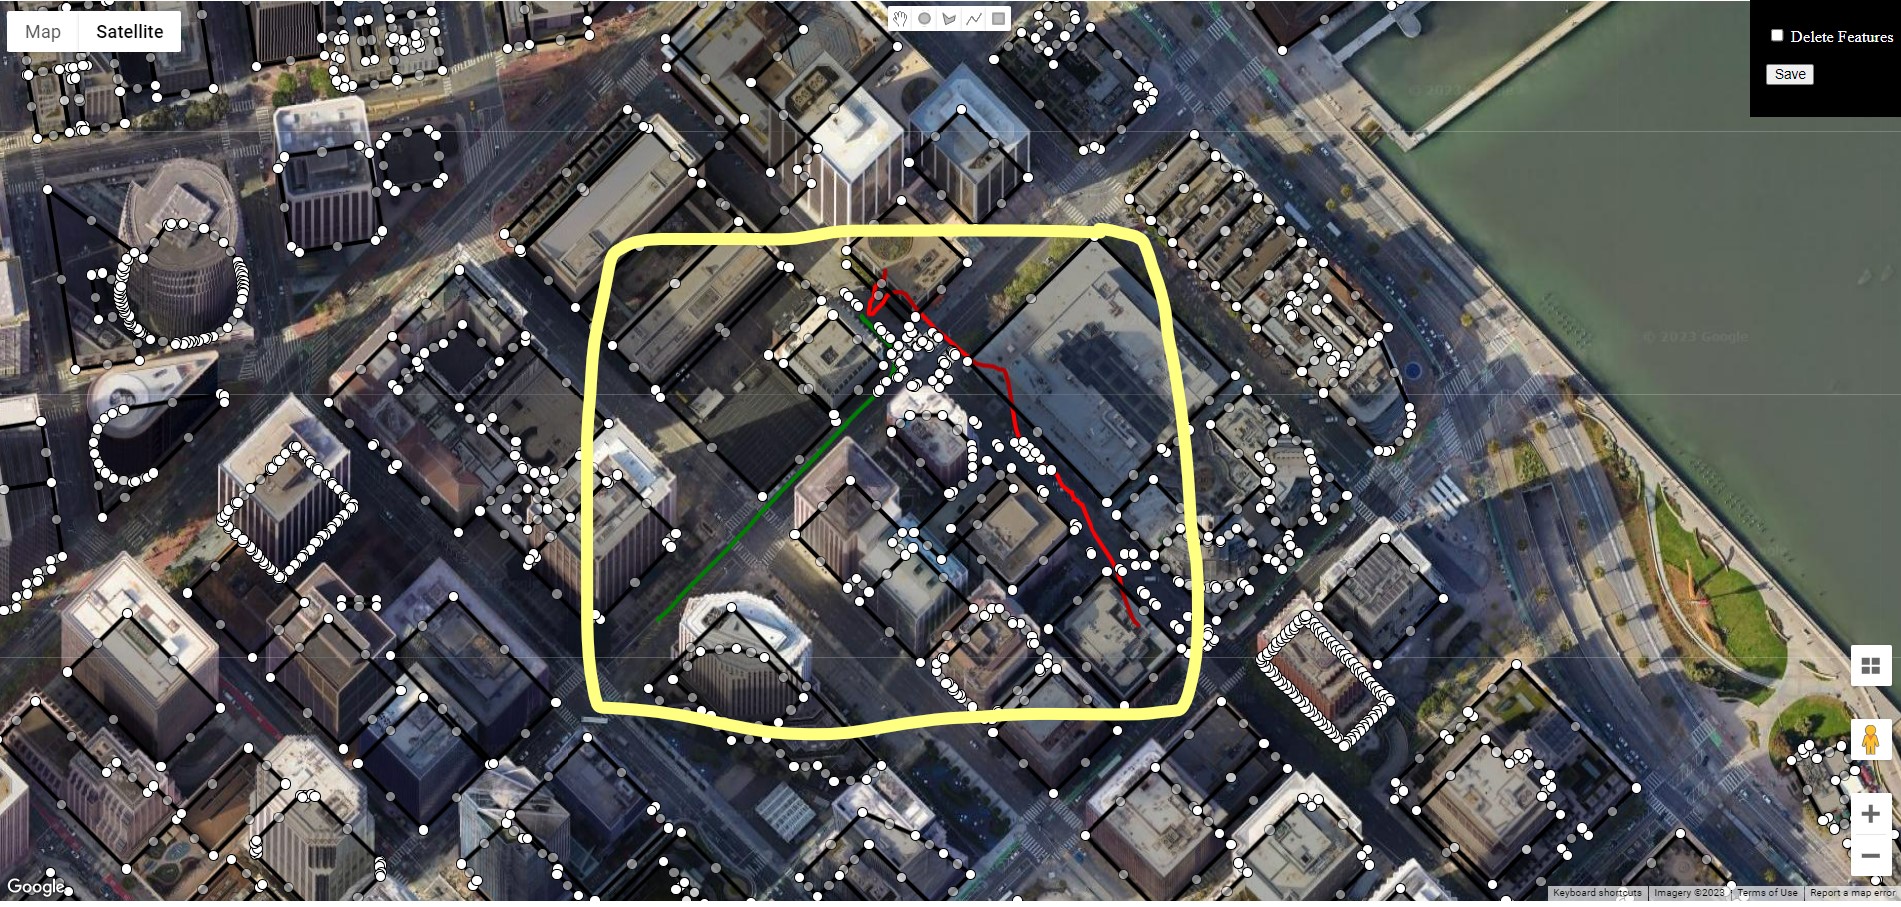
There are two types of trajectories in the tool red and green.
The red line is the GPS data trajectory, which was created after the data was collected. The green line is the trajectory that was created after the data was ground-truthed by the hyperspec team. You will learn more about this in the ground-truthing section.
Process
-
In order to get a highly accurate ground truthed trip, a user would need a higher number of evidence and reference features. The evidence and reference features can be present on both sides of the trip from point A to point B. eg. buildings, road markings, road edges, etc.
-
Imported buildings already exist as a feature. There may be a possibility that these features are not perfectly aligned on the map. Users can align the buildings to use as a reference for the trip.
-
In some cases, there are not enough buildings to use for reference. In such situations, users can annotate road marking eg. dash lines, solid white lines, solid yellow lines, and zebra crossing to use as a reference for ground truthing.
Edge Case
- In some cases, satellite images are not exactly top-down. In major cases, this situation arises in cities like San Francisco. Eg.
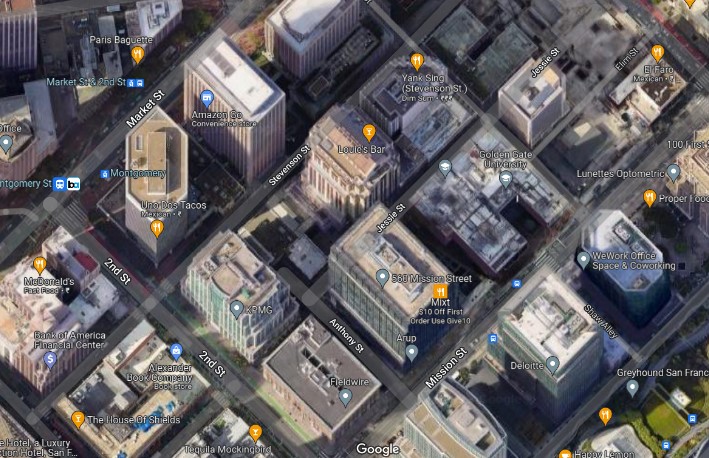
In this situation, to get higher accuracy user should annotate the road markings. As compared to buildings these markings will be exactly at the base.
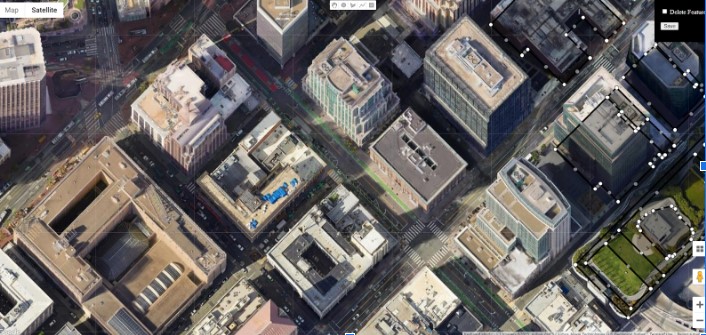
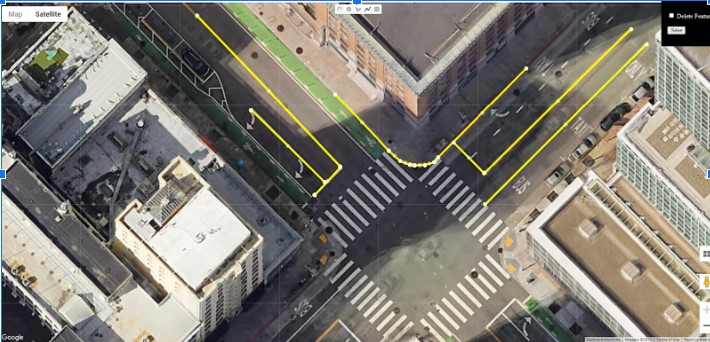
Yellow lines are exactly at the road markings. these will be more accurate as compared to building top.
